sales analysis
use sales data for profitability
reporting and visualization
the enterprise edition takes your sales
data and lets you use it on custom reports, category reports, visual
sales reports and the presentation manager. there are special fields
for profitability, turnover, gross and net margins and you create
your own formulas and use them on reports as well.
automatically set up sales periods for daily, weekly, monthly,
quarterly and annual reporting. sales data can be easily imported
from excel and kept for past sales analysis. sales information can
be rolled up depending on the original period used. if you have
daily sales data, then you can report on it daily, weekly. monthly,
etc. but if your sales data is monthly, then you can't report on it
daily or weekly, only monthly, quarterly, or annually.
specifying sales report dates
sales information can be incorporated into the custom report writer,
into visual sales reports and into category reports. you can choose
the sales dates for the report based on:
* effective start and end dates specified in the plan properties.
* start and ending periods
* a range of dates
* based on current date, which can give you:
- the current day, week, month, quarter or year.
- the previous day, week, month, quarter or year.
- previous sales for the last 5 days, weeks, months, quarter
or year.
category report
here we have a category report summing up each category on a monthly
basis, units sold and gross profit dollars for the first 6 months.
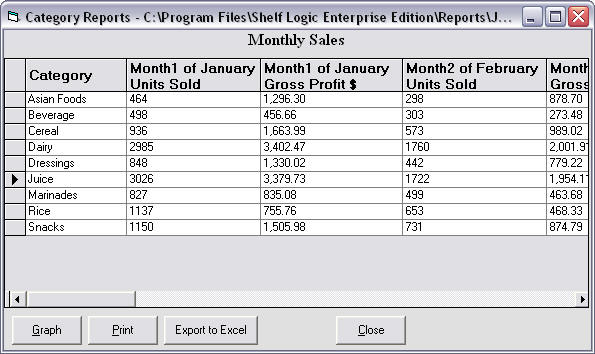
the report can be scrolled to see the other months in the report.
visual sales report
this next report is a visual sales report showing the actual profit
% by coloring the product faces according to the results. this
report groups the profit percents into 5 groups, with each a
different color. the report covers the sales for the first 3 months
of the year. the sales color key shows the actual percentages of
each grouping.
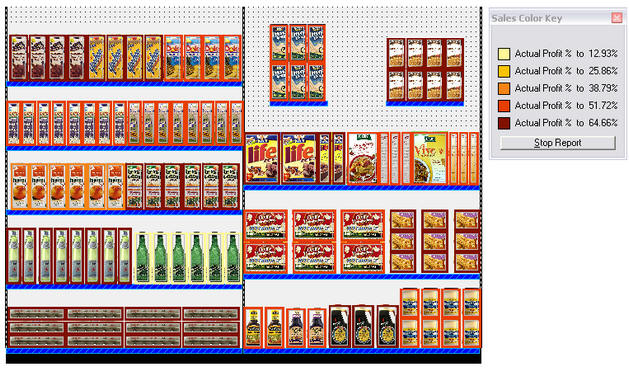
this makes it easy to identify more profitable products on the planogram.
sales reports
this next use of sales information is for reports. in the report
below, we show the net sales, gross margin and profit margin for
each category on the plan.
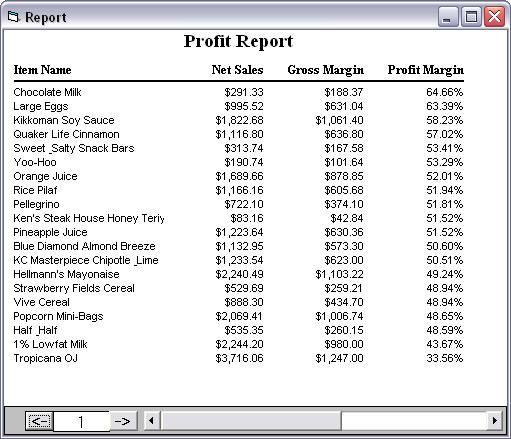
the report is sorted by the last column, the profit margin, with the
largest profit coming first.
|