report
writer
create custom
reports from your plan
the enterprise edition has a custom report writer included
for creation of your own reports. create complex
analytic reports using mathematic formulas.
modify the reports included with the software. you can report using any database field
and any of over 150
included plan functions.
● print report - to paper of pdf
● export to excel
● create html page with report
● display on screen
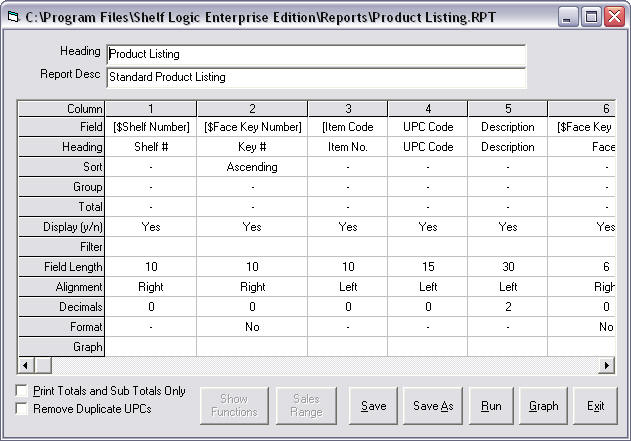
this is a sample product listing report.
report properties
each column is a column on the report. each row represents the
properties of the column. they are:
heading - this is the column heading that appears in the
reports. it can be multiple lines if desired.
sort - you can optionally sort the report by this column,
either ascending or descending.
group - this lets you group similar faces having the same column
value.
total - you can total the report, create sub totals for
groups, or averages.
display - you can hide this column on the report if desired.
this lets you sort or filter using this field but not display it.
filter - selects records based on the value in this column
compared to the value entered in this cell.
field length - this is the width of the column on the report.
alignment - lets you justify the column left, right or
center.
decimals - this is the number of decimal places you wish to
display.
format - lets you display currency, percentages, commas in
numbers, etc.
graph - this will graph one or more report columns.
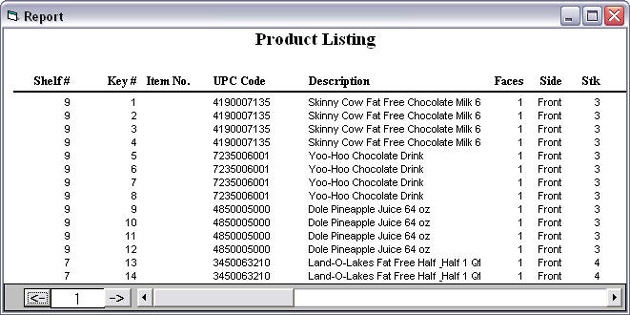
here's what the report looks like when run
when the report is run, each face on the plan becomes a line on the
report. you can also combine similar products so they appear only
once on the report.
plan functions
there are over 150 plan functions included. the plan functions are
divided into groups according to their scope. they are:
face level functions - these give you information about a
single facing on the plan.
product level functions - these give you information about
all of the product on the plan.
product sales level functions - these use sales figures to
give you projected and actual profit information.
shelf level function - these give you information about the
shelf and all products on the shelf.
section level functions - these give you information about a
section, and all of the peg and shelf products in that section.
plan level functions - gives you information about the plan
and all peg and shelf products on the plan.
here are some examples:
plan face area - gives you the total area of all product
faces on the plan.
shelf net sales - gives you the net sales for all products on
a particular shelf.
section peg units sold - gives you the total units sold for
all peg products in a particular section.
product sales actual profit per cuft - gives you the profit
per cubic foot for a particular product.
face stack - gives you the number of product stacked together
in a product face.
using these functions and mathematic combinations of these functions
let you create sophisticated profit analysis reports at all plan
levels.
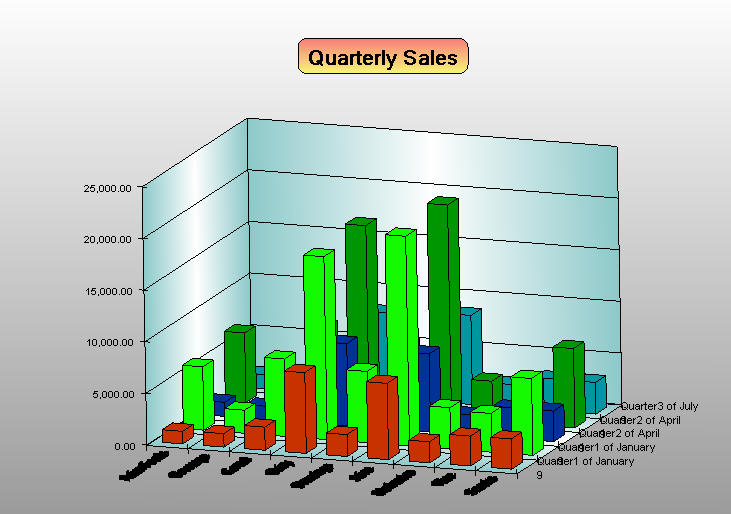
3d graphing
using the report writer, you can graph one or more fields on the
report.
 |