category management
features to help you identify
and report on categories
shelf logic comes with two main category
management features. the first is used to identify the categories on
your plan and the second lets you create category management
reports that show you how categories are doing over a period of
time.
identify a single
category
each category (or other field) is
displayed in the small window. when you click on each category, the
products on the plan that belong to that category are colored.
as each category is selected, the
product groups are selected for easy identification.
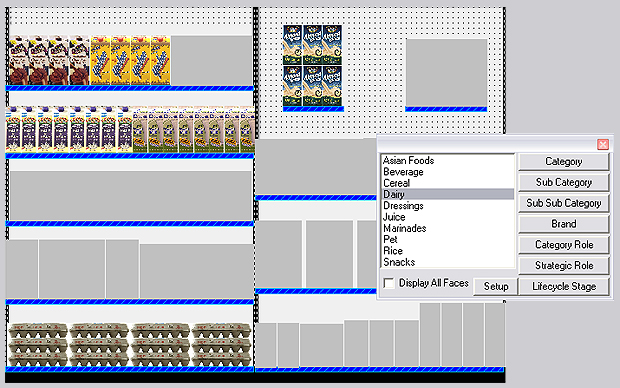
the products in each
category are colored as each category is selected
you can identify
products by:
|
● categories
● sub categories
●
sub sub categories
|
● brand
● category role
●
strategic role
|
● lifecycle stage
|
there are a number of
options for coloring and displaying the categories
identified.
identify all categories
you can identify all categories (or
brands, etc.) on your plan by coloring each a different color. a category color key window tells you
the color of each category (or brand, etc).
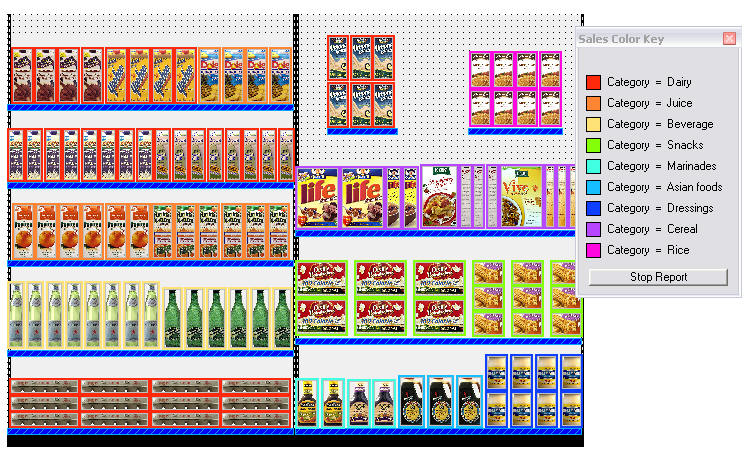
you can identify
products by:
|
● categories
● sub categories
●
sub sub categories
|
● brand
● category role
●
strategic role
|
● lifecycle stage
|
category reports
you can run
summary reports based on category, sub category and brand. you can
report on up to 5 fields for any time period you wish.
sales amounts
can be grouped daily, weekly, monthly, quarterly or yearly.
in this example. we
are looking at the net sales for each category for the first 4
weeks on january. we are grouping the data by weeks
and summarizing by category.
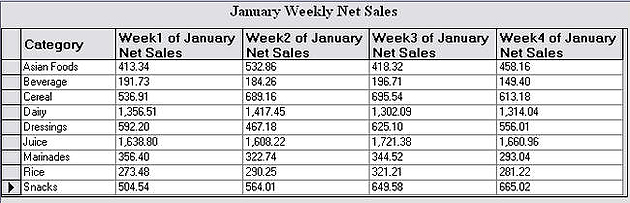
the report data can
be graphed, printed or exported to excel, and
can be included on presentation manager reports..
|