POWERFUL PLANOGRAMS WITH FLOOR PLANNING
FEATURE-PACKED PLANOGRAM SOFTWARE
PROFESSIONAL PLANOGRAMS IN MINUTES
COMING SOON
CHANGE AND VIEW PLANOGRAMS ON THE GO
VIEW PLANOGRAMS ON THE GO
RESIZE PHOTOS WITH QUICK AND EASE
PRODUCTS
SERVICES
COMPANY
RESOURCES
FREE TRIAL

CATEGORY MANAGEMENT
REPORTING CAPABILITIES
RIP PROCESSOR
ADDITIONAL FEATURES
SALES ANALYSIS
ENTERPRISE EDITION
BUY NOW
FREE TRIAL
SALES ANALYSIS:
VISUAL SALES REPORTING
HIGHLIGHT PRODUCT FACINGS
Visual Sales Reporting lets you create reports with positional information by coloring the products according to a variety of scenarios. This lets you evaluate the placement of products for optimum sales
THE VISUAL SALES REPORTING FEATURE COLORS PRODUCT FACES ACCORDING TO FOUR KINDS OF ANALYSIS:
- Threshold Analysis
Highlights according to a 'threshold' value for a field. For example, face are colored green if they have sales less than a certain value, and colored red if they exceed that value.
- Quadrant Analysis
Highlights according to the comparison any two fields for four combinations of over or under a value.
- Group Comparison
Highlights according to one field and breaks it into groups of equal or unequal values. You can use this to show the top and bottom 10% of performing products, for example.
- General Compare
This lets you compare multiple fields to multiple values. This has tremendous flexibility in letting you highlight according to your own rules.
EXAMPLE 1: PROFITABILITY ANALYSIS
Here's an example that shows the top and bottom 10 and 20 percent of product profitability. The color key shows what the colors mean. Products in between to top and bottom are colored black.
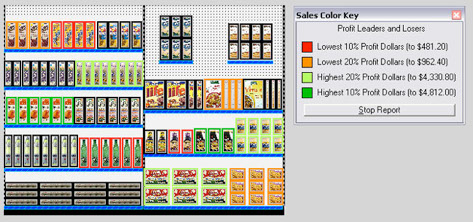
The actual values are shown in the color key and can also be shown on the product faces. The Visual Sales Reporting Module lets you easily identify products that are selling well and those that are not.
EXAMPLE 2: INVENTORY TURNOVER
The following Visual Sales Report shows the inventory turnover of each product on the plan.
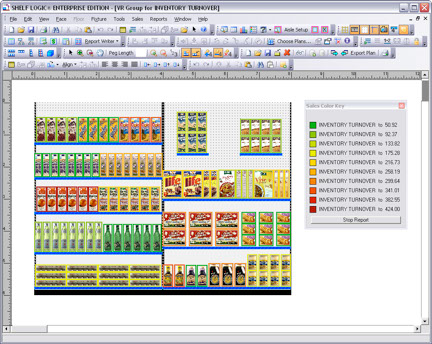
The Color Key even shows you the exact amount for each turnover range.
So the Visual Sales Reports not only show you amounts and calculations as with normal reports, it relates the information to product positions directly on the plan.
PRODUCTS
SERVICES
RESOURCES
COMPANY
CONNECT
How to Order