POWERFUL PLANOGRAMS WITH FLOOR PLANNING
FEATURE-PACKED PLANOGRAM SOFTWARE
PROFESSIONAL PLANOGRAMS IN MINUTES
COMING SOON
CHANGE AND VIEW PLANOGRAMS ON THE GO
VIEW PLANOGRAMS ON THE GO
RESIZE PHOTOS WITH QUICK AND EASE
PRODUCTS
SERVICES
COMPANY
RESOURCES
FREE TRIAL

CATEGORY MANAGEMENT
REPORTING CAPABILITIES
RIP PROCESSOR
ADDITIONAL FEATURES
SALES ANALYSIS
ENTERPRISE EDITION
BUY NOW
FREE TRIAL
CATEGORY MANAGEMENT:
HELPING YOU IDENTIFY & REPORT ON CATEGORIES
Shelf Logic's Category Management features let you identify and report on categories and sub categories. The first is used to identify the categories on your plan, and the second lets you create category management reports that show you how categories are doing over a period of time. Custom reports show the profit contribution for each category and how it compares to other categories.

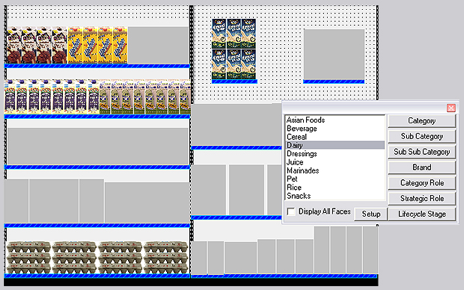
The products in each category are colored as each category is selected.
CATEGORY IDENTIFICATION:
IDENTIFY A SINGLE CATEGORY
Identify individual categories to determine product distribution across the planogram. You can also identify the distribution of products not just by category, but also by sub category, sub sub category, brand and more.
As each category is selected, the product groups are selected for easy identification.
CATEGORY IDENTIFICATION:
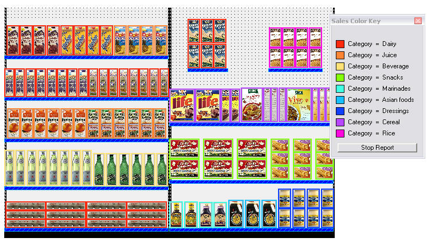
IDENTIFY ALL CATEGORIES
All categories can be displayed at one time to show you the comparison between the categories. Along with categories, you can display all sub categories, sub sub categories, brand and more.
The plan shown below displays all categories.

A Category Color Key window tells you the color of each category (or brand, etc).
CATEGORY REPORTS
Create summary reports that show you historical data based on category, sub category and brand. You can summarize on a daily, weekly, monthly, quarterly or yearly basis.
In this example. we are looking at the Net Sales for each category for the first 4 weeks on January. We are summarizing the data by weeks and grouping by category.

The Report data can be graphed, printed or exported to Excel. It can even be included on Presentation Manager Reports.
PRODUCTS
SERVICES
RESOURCES
COMPANY
CONNECT
How to Order